International Merchandise Trade Statistics - July 2024
1. National Sustainable Development Plan Indicators (NSDP)
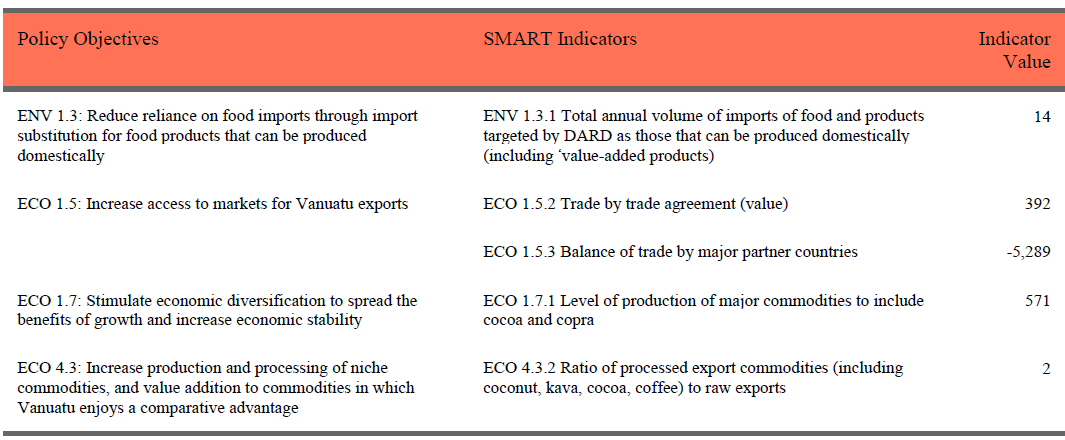
Total value of imports targeted by Department of Agriculture and Rural Development (DARD) as those that can be produced domestically is VT 14 million (ENV 1.3.1). The products imported included Potatoes (VT 5 million), Onions and Shallots (VT 5 million), Cauliflower and Broccoli (VT 1 million), Carrots and Turnips (VT 1 million), Capsicum (VT 1 million), and Tomatoes (VT 1 million). (Refer to Table 16)
The total value of the Melanesian Spearhead Group (MSG) agreement is VT 392 million (ECO 1.5.2). This Trade-by-Trade agreement included total exports of VT 97 million and total imports of VT 295 million. (Refer to Table 11). The Balance of Trade by Major Partner Countries is VT -5,289 million (ECO 1.5.3). (Refer to Table 8)
Level of production of major commodities is VT 571 million (ECO 1.7.1). The major commodities included, Cocoa (VT 61 million), Coconut Oil (VT 16 million), Kava (VT 485 million) and Wood (VT 10 million). The ratio of processed export commodities including coconut, kava, cocoa, and coffee to raw exports is 2 (ECO 4.3.2). Total value of processed exports is VT 379 million and total value of raw exports is VT 182 million. (Refer to Table 6)
2. Trade Balance by Major Partner Countries
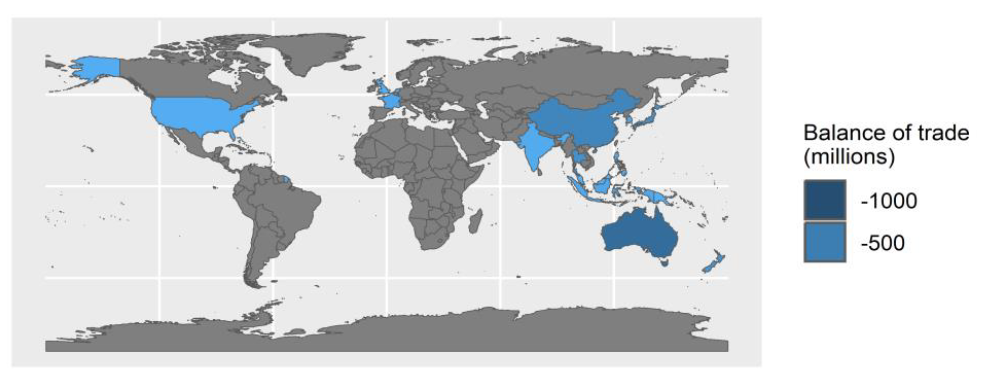
Balance of trade by major partner countries is VT -5,289 million. The main countries that account for this Balance are Singapore (VT -1,165 million), Hongkong (VT -1,394 million), Australia (VT -671 million), China (VT -425 million) and Japan (VT -312 million). These countries represent 75 per cent of the total Balance by Major Partner Countries (VT -3,968 million). (Refer to Table 8)
Major imports from Australia were Prepared Foodstuffs, Beverages, Alcohol, and Tobacco (VT 209 million) and Machinery & Electrical Appliances (VT 138 million). Major imports from China were Base Metals and articles (VT 103 million), and Machinery & Electrical Appliances (VT 79 million). Major imports from Hong Kong were Miscellaneous manufactured articles (VT 1,306 million) and Vehicles, aircraft and transport equipment (VT 41 million). Major imports from Japan were Vehicles, aircraft and transport equipment (VT 276 million) and Machinery & Electrical Appliances (VT 16 million). Major imports from New Zealand were Machinery and Electrical Appliances (VT 96 million) and Wood, Cork, and Plaiting Materials (VT 80 million). Major imports from Singapore were Mineral Products (VT 1,112 million) and Machinery & Electrical Appliances (VT 24 million)
3. Trade Balance of Pacific Islands (excluding Melanesian Islands, Australia and New Zealand)
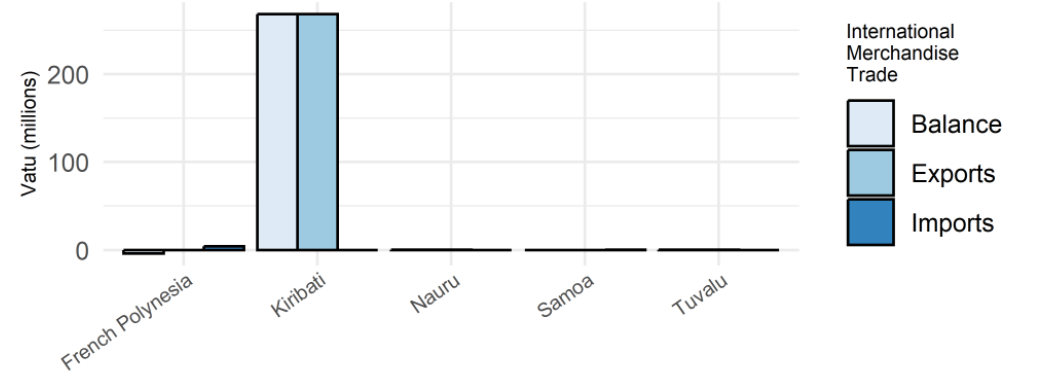
Total Trade Balance of Pacific Islands excluding Melanesia, Australia and New Zealand is VT 264 million. This was driven by exports of Kava to Kiribati (VT 268 million), and imports of Medicaments and Miscellaneous goods from French Polynesia (VT 4 million).
4. Trade by Trade Agreement- Melanesian Spearhead Group
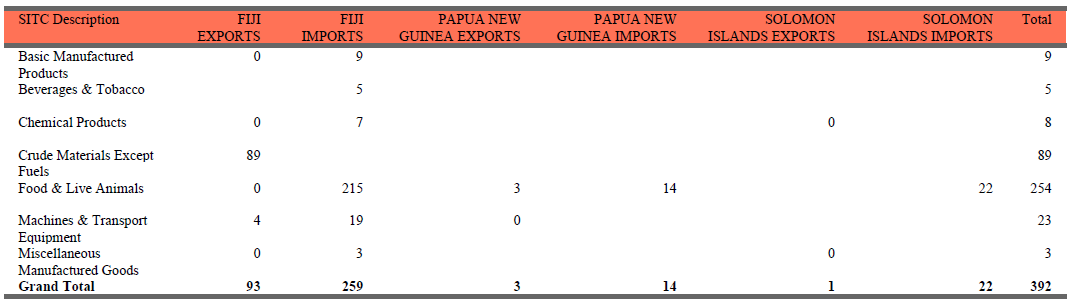
The major imports from Fiji are Prepared foodstuffs, beverages, spirits and tobacco (VT 192 million), and Bread, Cakes, Pastry and Biscuits (VT 57 million). The major imports from Papua New Guinea are Prepared or Preserved Fish (VT 8 million), and from the Solomon Islands is also Prepared or Preserved Fish (VT 22 million).
The major export to Fiji is Kava (VT 89 million), to Papua New Guinea is Yeast (VT 3 million), and to Solomon Islands is Medicaments (VT 0.4 million).
5. Principle Exports
The level of production of the top five Major Principal Exports is VT 561 million. The Principal Exports identified included Cocoa (VT 61 million), Coconut Oil (VT 16 million), and Kava (VT 485 million). (Refer to Table 6)
The major country of destination for Cocoa is Malaysia (VT 61 million), for Coconut Oil is Taiwan (VT 16 million). Kava is exported mainly to Kiribati (VT 265 million), Fiji (VT 89 million), and the United States of America is (VT 45 million).
6. Top 5 New Major Exports
Total value of Crude Kava Extracts VT 60 million, Documents VT 14 million, Scrap Metal VT 11 million, ATM Machine parts VT 4 million, and Yeast VT 3 million.
7. Principle Imports
Total value of top five Principal imports is VT 1,515 million. The Principal Imports included Alcoholic Drinks (VT 125 million), Articles of Iron and Steel (VT 125 million), Medicaments (VT 60 million), Petroleum Oils (VT 1,156 million), and Rice (VT 50 million) .(Refer to Table 7)
The main country of origin for Alcoholic Drinks is Australia (VT 53 million). The main country of origin for Articles of Iron and Steel is China (VT 42 million), and Medicaments is Australia (VT 29 million). The main country of origin for Petroleum Oils is Singapore (VT 1,110 million), and Rice is Taiwan (VT 50 million).
8. Top 5 New Major Imports
Total value of Steel structures VT 1,302 million, E Passport Booklets VT 59 million, Container VT 36 million, Exhibition goods VT 34 million, and Islander Air Craft VT 24 million.
9. Imports of Dietary Risk Factors for Noncommunicable Diseases
Total value of Bakery Products is VT 105 million and are mainly imported from Fiji (VT 57 million). Total value of Confectionary is VT 31 million and are mainly imported from Australia (VT 12 million). Total value of Cordial is VT 40 million and are mainly imported from Australia (VT 15 million). Total value of Noodles is VT 4 million and are mainly imported from New Zealand (VT 3 million). (Refer to table 15)
10. Imports of food and products targeted as those that can be produced domestically
Total value of Canned Mackerel is VT 27 million and are mainly imported from Fiji (VT 22 million). Total value of Canned Tunas is VT 62 million and are mainly imported from Solomon Islands (VT 22 million). Total value of Chicken is VT 66 million and are mainly imported from Brazil (VT 34 million). Total value of Chicken Eggs VT 15 million and are mainly imported from Fiji (VT 15 million). (Refer to Table 17)
Table Downloads
The format content in these monthly provisional highlights is as below:
- National Sustainability Development Plan (NSDP Indicators: The NSDP serves as the Country’s highest level policy framework. The indicators provide a system to monitor progress. To report on trade related NSDP indicators, some adaptions has been made. This include ENV E.3.1 report value, not volume ECO 1.5.2 and ECO 1/6/2 reporting on Melanesian Spearhead Group (MSG) agreement, ECO 1.7.1 reporting on level of export production of major commodities.
- Trade Balance of Major Partner Countries: Balance of Trade is the value of a country’s exports and the value of a country’s imports for a given period. The Major Partner Countries are: Australia, China, Fiji, France, Hongkong, India, Indonesia, Japan, South Korea, Malaysia, Netherlands, New Caledonia, New Zealand, Papua New Guinea, Philippines, Singapore, Solomon Islands, Thailand, United Kingdom and United States of America.
- Trade Balance of Pacific Islands, excluding Melanesian Islands, Australia and New Zealand: The Pacific Islands included are: American Samoa, Tonga, Cook Islands, Kiribati, Federated States of Micronesia, Micronesia, Marshall Islands, Nauru, Niue, Palau, Samoa, French Polynesia, Tuvalu and Wallis and Futuna.
- Trade by Trade Agreement - Melanesian Spearhead Group: The Melanesian Free Trade Agreement (MFTA) aims to achieve regional integration of economics in the MSG. It comprises four (4) Countries namely, Fiji, Papua New Guinea, Solomon Islands and Vanuatu.
- Major Principal Exports: Major Exports are commodities that account for the majority of the total export value. The commodity group focus is Beef, Cocoa, Coconut Oil, Copra and Kava. Focus is a time series analysis of current monthly exports from 2018 to 2023.
- Top 5 New Major Exports: The traditional VNSO tables report on 13 major commodities. The rest of the commodities are grouped as “other products”. This investigates the main commodities within “other products”.
- Major Principal Imports: Major imports are commodities that account for the majority of the total import value. The commodity group focus is Alcoholic drinks, Articles of Iron and Steel, Medicaments, Petroleum oils and /Rice. Focus is a timeseries analysis of current monthly imports from 2018-2023.
- Top 5 New Major Imports: The Traditional VNSO tables report on 47 major import commodities. The rest of the commodities are grouped as “other Imports”. This investigates the main commodities within “other imports”.
- Imports of Dietary Risk Factors for Non-Communicable Diseases (NCD): The Pacific has a growing reputation as having one of the world’s highest NCD rates. These major NCD, is share for behavioural risk factors; tobacco use, unhealthy diet, physical inactivity and harmful use of alcohol. This investigates some of the dietary risk factors including Bakery Products, Canned Meats, Confectionary, Cordial and Noodles.
- Imports of Food and Products Targeted as those that can be Potentially Produced Domestically: Import substitution is the idea that; blocking imports of manufactured goods can help an economy by increasing the demand for domestically produced goods. The imports of foods and products targeted include: Canned Mackerel, Canned Tunas, Chicken and Chicken eggs.